Are You a Slacker, too?

I don’t often take other free market economists to task for a lack of intellectual rigor, but that’s exactly my plan today.

You see, it’s tax season and that always brings rumblings about how many Americans actually pay taxes versus the number of freeloaders who are content to let others do the heavy lifting of supporting our fat, stupid, and lazy Uncle Sam.

In a recent article, libertarian economist, Ryan McMaken, takes issue with a Tax Policy Center report indicating that roughly 45% of Americans pay no income tax. McMaken claims the statement is “obviously” untrue.

His evidence for the inaccuracy of the report is his insistence that 73.1% of all Americans pay either an income tax, payroll tax (FICA), or some combination of the two. Unfortunately, McMaken is guilty of missing the trees for the forest.

While it is true that FICA taxes are no different from any other general revenue of the government and are used to fund government operations, it is a mistake to assume that just because a person pays into FICA they are technically taxpayers.

Here’s why…

In the United States, there are two entities: taxpayers and tax consumers. You can’t be both. Either you pay taxes or you don’t. There’s no middle ground.

Now, before we go deep enough to piss off all the country’s slackers, let’s define some economic terms. In economics, we must distinguish between things that are real and things that “appear” to be real.

Real things are called, you guessed it, real – as in “real GDP.” Things that “appear” to be real are called “nominal.” Thus it isn’t uncommon to hear economists talk about the difference in nominal GDP numbers versus real GDP numbers.

What’s the difference?

Real numbers have a real value. For example, when Barack Obama gets word that nominal GDP grew by 3% at some particular time – he gets excited and claims his programs are working great. That is… until an economist wakes him up to the reality that inflation over that same time was 2%. That means the real GDP was just 1% – and even a Harvard Law grad could understand that’s a terrible number.

The same idea works in your investments, too. If you earn a 10% return on an investment and inflation for the year is 3%, your ‘real’ rate of return is actually 7%. Real numbers matter.

Now, in examining taxes, economists do something similar. That is, we distinguish between real taxes and nominal taxes. Real taxes are real revenues paid to the government. Nominal taxes are taxes that appear to be real, but are, in fact, not real.

Let’s take a closer look…

Let’s say you’re an FBI agent making $75,000/year in salary. For this illustration, we’ll ignore the impact of any employee benefits or state income taxes.

Depending on the number of exemptions claimed by the employee, an FBI agent should expect to pay approximately $13,238 in taxes to the federal government. This includes an effective income tax rate of about 10% and another $5,738 in FICA taxes. In McMaken’s eyes, the FBI agent is a bona fide taxpayer.

Only he isn’t…

You see, the FBI agent’s salary actually cost the government nearly $81,000 (including FICA taxes). In return, the government is ‘refunded’ just over $13,000 as a tax over-payment (nominal taxes). This means the FBI agent consumed roughly $68,000 ($81,000 – $13,000 = $68,000) of the nation’s wealth.

Now, because the government received no new revenues from the FBI agent, the agent cannot be considered a taxpayer. In pure economic terms, the FBI agent is equivalent to a freeloader (that should get me some hate mail).

Unfortunately, it’s not just government employees who don’t pay real taxes, either.

Any person in the United States who gets more money from the government than they pay to the government is a tax consumer – not a taxpayer. In short, they contribute nothing to the operation of the government, while often demanding ever-increasing benefits from those actually paying the nation’s bills.

At the end of the day, no nation can long continue whereby half the population lives at the expense of the other half. But don’t expect to see changes anytime soon, regardless of which party is elected in November. Both parties benefit from maintaining the immorality of the status quo, and nothing short of bankruptcy will ever change that.

Not even the hopeful writing of a libertarian economist.

Economic Risks Growing…

Economists use many tools to quantify economic activity. Some are better than others, but all are useful to some degree.

But one of the most useful, yet underutilized, tools is a relatively obscure measure of economic health and vitality called M2 Velocity. M2 Velocity is a ratio of nominal gross domestic product (GDP) to the money supply (M2). Pretty boring, I know, but think of it as the number of times one dollar is used to purchase final goods and services in the economy.

Now, despite this gauge’s superb value in measuring the health of an economy, very few people outside of the field of economics grasp the importance of M2 Velocity. Instead, most pundits prefer to discuss more widely understood economic measurements, such as GDP.

And that’s exactly what happened this morning when the government revised its fourth quarter GDP estimates from 0.7% growth to a 1.0% (both are terrible numbers, by the way). Many pundits breathed a sigh of relief to see some evidence that the U.S. didn’t fall into recession late last year as some economists feared.

But M2 Velocity indicates we’re not out of the woods yet – not by a long shot…

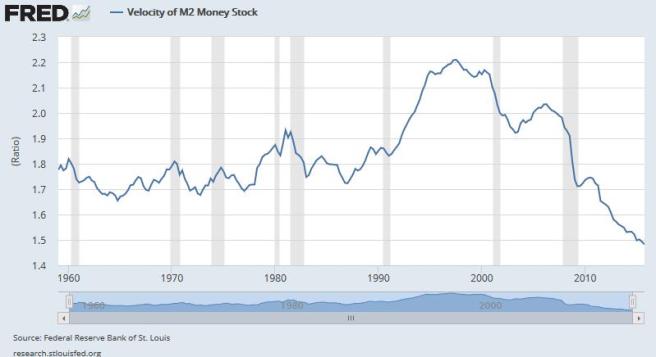
As you will see in the chart below, the velocity of money ebbs and flows like many economic indicators. When the gauge rises, it indicates greater levels of economic activity as a dollar changes hands much more frequently. On the other hand, when the gauge declines, it indicates that fewer goods and services are being purchased with that same dollar.

M2 Velocity

Since 1958, the M2 Velocity has roughly channeled between 1.7 and 1.9. The gauge rose above its historic average in the 1980s and 1990s as the economy experienced healthy expansion rates. On the few occasions that M2 Velocity fell below the bottom of the channel of 1.7, it was a relatively short-lived occurrence.

But even a casual glance at the gauge will tell you there is a problem. The M2 Velocity has been falling for more than a decade and now sits at 1.482, the lowest level ever recorded.

So what does this mean?

A declining velocity of money means people are spending less disposable cash than ever despite a massive expansion in the money supply by the Federal Reserve. More importantly, it’s an indication that the economy is being pulled down by cyclical deflation.

Now, I’m not given to apoplithohorismosphobia (love that word!). For the uninitiated, apoplithohorismosphobia is the fear of falling prices leading to uncontrolled deflation. So, while falling prices isn’t the bogeyman many people think it is, to Keynesian economists, it is to be avoided at all costs.

That’s why the Federal Reserve constantly tries to drive inflation in the economy.

And it’s the reason this graph unsettles the Federal Reserve. After more than 5-years of zero interest rates and three rounds of quantitative easing, the Fed’s monetary policy has had no real effect on inflation – or in slowing the descent of M2 Velocity.

The continuing decline in the velocity of money indicates that consumers remain uncomfortable with the status quo. More importantly, if the low levels of demand continue unabated, central banks around the world risk a global depression if it isn’t resolved soon.

But to reverse the downward trend in money velocity, the federal government must shift into growth mode by removing the uncertainty that comes with excessive control and regulation of the economy. Even in the best times, government regulations make economic expansion difficult. But the sheer volume of regulations in today’s anemic economy threatens our very way of life.

The moral solution is for the federal (and state) governments to curtail their regulatory overreach, get spending under control, reduce taxes for individuals and corporations, and allow free economic activity to return.

It may be a pipe dream, especially listening to each party’s presidential candidates, but a downward economic spiral continues unabated, and time is no longer on our side.


Earnings B.S.

One of the most important truisms of investing is that stock prices follow earnings. Follow this rule and you’ll find success as an investor.

Unfortunately, most investors make a huge mistake in getting their earnings data from crackpot financial reporters that have no fundamental understanding of how companies manipulate data.

You see, most investors remain unaware that companies effectively maintain two sets of books. The first contains a comprehensive report of the company’s performance according to generally accepted accounting practices, or GAAP, for short. These results are required to be submitted to the SEC once a quarter, and require the signature of the chief executive.

The second set is for fun. Well, not really…

The second set is often referred to as “pro forma” or adjusted results.  Here a company can report their financial results to investors that contain ‘adjustments’ to the real results. And as you might expect, these adjustments are used to make the company appear more profitable than their results indicate.

proforma earnings

Now, I’m not saying there is never a good reason to make adjustments to a company’s results. There are times when a company is taking one-time expense for layoffs or plant closings, etc. Since these costs won’t recur every year, it’s perfectly acceptable to make the adjustments.

The problem is that some companies have a history of abusing the rules allowing them to make adjustments on items that aren’t one-time expenses. One such company is Salesforce.com (NYSE: CRM).

Salesforce.com frequently claims ‘one-time’ adjustments to expenses that are reported every single quarter. In their most recent 10-Q filing, the company reported that they lost $26 million in 4Q2015.

This should have put downward pressure on the stock price.   But that didn’t happen…

In fact, the stock rose more than 10.2% on heavy volume to close at $69.42 per share on Thursday. What accounts for the increase after the earnings decline?

The company adjusted its earnings to remove the cost of stock options it granted to its employees, which cost the company more than $159 million. And by eliminating the options costs, the company could magically report to investors that it earned $133 million in the quarter instead of the loss as reported to the SEC.

This is what gunned the stock higher.

But it’s a fraud. Employee compensation is a normal cost of doing business, and to treat it as a one-time expense is nothing short of dishonest. The company did it to make investors believe that management successfully grew their earnings in the quarter. And to hide the fact the company rewarded its employees with all of the company’s profits in the quarter.

Warren Buffet’s right hand man, Charlie Munger, has famously described adjusted earnings as “bullshit earnings.” And he’s right.

If you want to be a better stock picker, you need to pay attention to earnings. And the real earnings, not the earnings reported by ethically challenged corporate executives or incompetent financial journalists.

Everything else is a warm pile of B.S.

The Mark of the Beast Draweth Nigh…

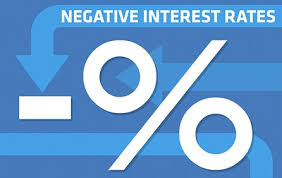
Despite recent reports to the contrary, the Federal Reserve is actively engaged in bringing negative interest rates to the United States. By doing so, the Fed will bring its own monetary policy in line with central banks in Japan and most of Europe.

Why go negative on rates?

Well, current Keynesian models suggest that going negative will boost aggregate demand. And, we’re told by these folks that what this economy needs is a kick start to demand.

Of course, they care not to be reminded of their previous failures to drive demand with several years of zero interest rate policy (ZIRP) and three attempts at quantitative easing (QE). For all their efforts at driving aggregate demand, the only results are inflated stock prices and another growing bubble in real estate. That doesn’t include the trillions in additional debt!

As for the economy, it continues to be the weakest recovery in American history. And any further efforts at driving aggregate demand with negative interest rates will fail miserably.

You see, with a global economy on the verge of recession, very few banks are able to find credit worthy customers. This includes major U.S. companies that have loaded up on trillions of low yield debt in recent years to increase dividends and share buybacks. They’re simply tapped out.

Now, central banks are getting ever more desperate to increase demand. But as central banks around the world are learning, negative rates don’t work either.

Here’s why…

Interest rates are subject to the same forces of supply and demand as any other commodity. And any economic theory that presupposes investors would buy a one-year T-Bill for $1,000 only to get $995 a year later falls short of being a financial genius!

You see, investors are smarter than the average Keynesian economist who believes that people will pay the government or bank to hold their money. After all, an investor would be better of putting their money under a mattress. A year later, the investor still has $1,000.

And herein lies the problem…

Global governments cannot allow investors to take their money out of the economy by placing it under a mattress or in a safe deposit box. That defeats the purpose of negative interest rates, which is to force individuals to do something… or anything.

And there is only one way to prevent individuals from hoarding cash…

Ban it! Force everyone to convert their paper money into bank deposits by eliminating the use of cash for any and all transactions.

Think this is a far-fetched idea?

Norway’s biggest bank is demanding a ban on all cash transactions in that country, as is the Bank of England’s chief economist. Other countries such as Japan, China, Sweden, Switzerland, and Germany are also considering banning the use of cash in their countries.

The Danish Parliament leads everyone and has proposed a law allowing stores to refuse cash payments for goods and services. A vote authorizing such a ban is expected to pass.

Don’t think for a minute that calls to ban cash stop at our shoreline. Harvard economist, Kenneth Rogoff, made a case last year to eliminate cash transactions in the United States. Almost immediately, Citibank joined the cause when their chief economist seconded Rogoff’s idea.

The writing is on the wall…

The elimination of cash in the United States is inevitable. Eliminating cash gives the government greater control over the money supply and the ability to “guide” the economy toward the goals of the state.

For those old enough to remember the old Soviet Union, it’s reminiscent of the politburo’s infamous five-year plans that never seemed to materialize. But each failure brought promises of a new five year plan – similar to the claims of central banks now.

Would a cashless society be a bad thing?

Many Americans like the idea of a cashless society. Of course, many Americans think Bernie Sanders’ ideas about socialism are valid, too.

Still, the idea of using a debit card or smartphone for making all your purchases sounds like a good idea. After all, the U.S. government could save billions by not printing bills and minting coins.

Crime rates for robbery and theft of cash would disappear, as businesses would no longer have cash on hand. Banks could get rid of their bullet-proof partitions that annoy so many people.

The government could improve its efforts to calculate the correct inflation rate and gross domestic product (GDP). Best of all, the government could theoretically eliminate the black market – including illegal markets for drugs and other illicit products and services like prostitution.

I mean how many crack heads are going to buy drugs on their debit cards, right? And I’m sure whore houses across the country would see far fewer politicians, too.

But at the end of the day, the move to a cashless society is nothing more than a power grab by elite politicians and the ruling class to regulate every area of American life.

Every transaction you make will leave a paper trail that can (and will) be tracked. Your every move will can be ascertained within seconds every time you buy gas or pass a McDonald’s drive-thru window.

The IRS will know instantly whether you filed tax returns – and whether you declared all of your income. They would also have instant electronic access to your bank records – including the ability to block or limit access to said funds.

Chapter 13 of the Book of Revelation references the ‘mark of the beast.’ Whether you give weight to the Bible or not, the world is fast approaching a point where liberty is subordinated to the goals of the state.

And only a true believer in the altruistic benevolence of the state would be foolish enough to fall for such a unworthy goal. But foolish is the new tolerant in America.

Are We Headed to Another Recession?

Depending on your point of view, last Friday’s nonfarm payroll report showed some minor labor market weakening or a full-blown recessionary downtrend.

If you happen to believe that government economists are accurately calculating seasonal adjustments in labor market activity, Friday’s report showing a gain of 151,000 jobs is a relatively minor indication of labor market weakness.

On the other hand, you could look at the Bureau of Labor Statistics’ data showing a decline of nearly 3 million jobs since November as a trend that portends rough times ahead.

This begs the question…

Is the US heading into a recession, and, if so, when?

If a U.S. recession were imminent, we would naturally expect to see deterioration in the labor market. And that’s exactly what we’re seeing. And it doesn’t matter whether you look at the seasonally adjusted numbers or the BLS’ raw data. The result is that the job market in the U.S. is slowing down.

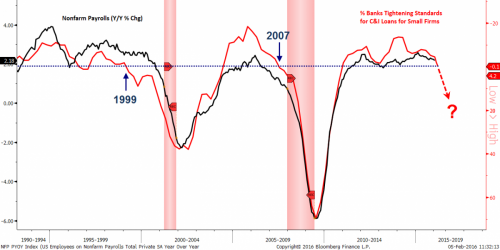
The following chart shows non-farm payrolls (in black) to be at roughly the same levels as just before two previous recessions in 1999 and 2007. Now, in and of itself, this downward trend doesn’t necessarily guarantee a future recession.

But when we add a leading economic indicator such as falling bank loan activity, the trend becomes clearer. As you can see, bank lending to small businesses (in red) is falling precipitously.

nonfarm-payrolls-banks-tightening

To be sure, falling bank lending is a sure-tell sign of weaker economic fundamentals.

And because bank tightening precedes declining payrolls by about 6 months, the negative employment picture accelerates as small businesses have difficulty funding their operations and meeting their payroll obligations.

This means we could see negative GDP numbers by spring 2016.

Now, it’s possible that banks will loosen their lending standards for small businesses in the interim. If that were to happen, we would expect employment trends to stabilize or even pick up.

But to date, there is no evidence that lending standards are getting looser. In fact, it’s quite the contrary. With the liquidity troubles brewing in the junk bond and ETF sectors, were seeing a decrease in bank lending as banks attempt to avoid the kinds of problems they experienced during the financial crisis of 2008.

For now, all signs point to continued deterioration in the unemployment outlook, and a stock market that will continue lower.


3 Million Jobs Missing Since November…

It’s been a rough start to the New Year.

We saw the worst opening week in the market’s history in January. Since then, the S&P 500 is down a bit more than 8%. That’s comparable to the 7.9% decline we saw in January 2008 – the year the financial crisis began.

But it’s not the worst January in recent memory. Back in January of 1990, we saw a peak-to-valley drop of more than 11.4% to start the year. By September of that year, the market had dropped 20%.

Then, like now, the market was reeling from several economic headwinds, such as the doubling of oil prices virtually overnight (thanks to Iraqi incursion into Kuwait). The economy slowed from 9.1% in 1Q1990 to a low of 0.4% by the end of the year. It was a bleak time. Sentiment was horrible and investors were panicking.

But just 13 months later, the S&P 500 was breaking out to new all-time highs.

So this begs the question…

Will 2016 see a bounce similar to what we saw in 1991?

I don’t think so. Here’s why…

Back in December 2015, we updated our clients with a warning about an impending drop in the S&P 500. At the time, the broad market index was at 2,064. But we expected to see a move to 1,800 followed by a bounce higher.

On January 20th, we saw the S&P hit 1,812 (intraday). Since then, it has bounced back, just as we expected. However, the index has been unable to hold its 20-day and 50-day moving averages, leading us to expect the market to fall by year’s end.

Now, that doesn’t mean it’s a lock. You see, the first step to see a move higher from here will be a retest of January’s intraday low of 1,812. And if that low doesn’t hold, expect a slow grind lower to about 1,600.

Fueling our pessimism are three concerns that lead us to believe a mini bear market similar to what we saw during the ’90 – ’91 period could be just ahead.

First are the job reports for December 2015 and January 2016, which on the surface, looked good. While the December number beat expectations, the January number fell short, although it posted a respectable increase.

Or so it seemed…

Like so many things coming out of Washington D.C., the numbers were phony.

You see, the Bureau of Labor Statistics (BLS) performs a seasonal adjustment to the employment numbers. This accounts for events such as weather, major holidays, and school schedules.

But taking out the BLS’ fictional adjustments, we find that the non-seasonally adjusted numbers for each month told a far different story. And it’s not a pretty one…

In November 2015, the BLS reported there were 144.180 million jobs in the United States. A month later, that figure rose to 144.191 million jobs – an increase of just 11,000 jobs. That’s a far cry from the 292,000 new jobs reported by the government.

But that’s not the end of it. Since that initial report, the BLS has revised those numbers. Now, the BLS says that the number of jobs in November 2015 was actually 144.122 million, while the adjusted December total was 144.112 million. That’s a decline of 10,000 jobs from November to December!

But wait, there’s something more sinister happening here…

Today, the BLS announced the creation of 151,000 new jobs for January 2016. Now, the BLS numbers are preliminary and will likely see another revision, but until then, they’re frightening.

You see, the BLS report indicates there were just 141.123 million jobs in the United States at the end of January 2016. That’s a decline of almost 3 million jobs in the last two months.

These numbers suggest the U.S. economy isn’t as strong as the political classes would have you believe. And we remain concerned that the labor weakness has not yet been priced into the stock market.

But the employment picture isn’t our only concern. The sharp drop in oil prices hasn’t been fully priced in either.

Now, lower oil prices are generally a very good thing for individuals, corporations, and most economies. You certainly don’t need a Ph.D. to figure out that low energy prices are a plus to an economy.

But the slide in oil is much worse than expected. It now looks like it could settle near $20 per barrel. This fall will negatively impact S&P 500 earnings for far longer than originally speculated.

And the severity of the decline will crush the junk bond market. Just like in 1990, this will create a liquidity crisis that will bleed over into the stock market.

And lastly, there’s China…

On January 18th, China reported GDP growth of 6.9%. We have a word in economics for China’s claim – poppycock!

That number is pure fiction. You see, based on China’s rate of electricity consumption, China is growing at just over 2% per year.

And the country cannot long pay its bills at that level of growth. So, in order to goose its economy, China will likely devalue its currency by another 15%.

This will automatically make American-made goods 15% more expensive to Chinese consumers, further crimping sales for American companies and reducing earnings for the index.

But a devaluation will also send a clear signal to other emerging market economies that a race to the bottom has been engaged. A global recession is almost unavoidable on that basis alone.

And taken in combination with the strong evidence of slowing U.S. employment and the continuing slide in oil, the stock market is significantly overpriced at current levels.

As such, we will continue to short this market.


Global Financial Crisis 2.0

Back in 1992, George Soros successfully broke the Bank of England by launching a massive speculative currency attack against the British pound. The resulting collapse forced the British government to pull the pound from the European Rate Mechanism (ERM).

Fast forward 24 years, and another speculative attack against a currency is building. And this one could leave the global economy in shambles.

You see, China has been struggling to contain an economic downturn that risks forcing the country to make choices its leaders are completely unprepared to make. But any failure on the part of the Chinese leadership to act could lead the country into a crisis that dwarfs the American financial crisis of 2008.

And evidence of the gathering storm is growing as Wall Street speculators are betting heavily against the Chinese renminbi – bringing to mind the British crisis in 1992. Recent filings indicate hedge funds are making significant bets that will pay enormous dividends if the yuan and the Hong Kong dollar fall over the next couple of years.

This has led some speculators to suggest the Chinese currency could plummet by as much as 40% over the next three years. While that seems overly pessimistic, it’s likely we’ll see devaluations of at least 15-20%. In either case, such a devaluation would be catastrophic for the global economy.

You see, any such move by the Chinese will inevitably guarantee cheaper Chinese goods flooding the globe. This will lead to pressure on Emerging Markets (EM) to devalue their own currencies in an effort to compete. From there, it’s a race to the bottom.

The bottom line is that there is a price to pay for Keynesian foolishness. China allowed its total debt load to swell to 280% of its GDP in an effort to bring prosperity to the masses. And all they have to show for it are millions of empty apartments and other unused capital assets.

They have no choice but to devalue. The alternative is politically unthinkable. The only question that remains is to what extent their folly decimates the world economy.

Wall Street Thieves…

On Tuesday, the Dow Industrials rocketed higher by more than 282 points to close the day at 16,167. That was more than enough to wipe out all of the previous day’s losses.

Interestingly, the catalysts for the move higher was optimism surrounding the earnings reports from two Dow components, 3M (NYSE: MMM) and Proctor & Gamble (NYSE: PG). Both companies reported their quarterly reports early Tuesday morning.

By the closing bell, each stock harvested gains of roughly 5% on the day. But a closer look at each company’s results is very telling about the degree of fluff Wall Street will publish as authentic analysis of U.S. equity markets.

You see, 3M had the slightly better day; closing up nearly 5.2% on what Reuters called a “better-than-expected quarterly profit and backed its 2016 forecast.” Complete gibberish!

3M had a disastrous quarter. The company’s revenues declined by 5.45% compared to the same period a year ago. In addition, earnings declined by 12%, and the company’s net margin also decreased from the year ago period. In short, 3M sucked wind.

So what made the dunderheads at Reuters so giddy?

3M cut 1,500 jobs in Q4 in an effort to save $130 million in pretax earnings for 2016! What this means is that Wall Street has lowered the bar so low that a company is no longer graded on its ability to grow revenue and earnings, but rather on its ability to reduce its tax bill by cutting jobs.

But wait, there’s more…

Proctor & Gamble closed the day on Tuesday 4.9% higher on good news, too. What was the news?

P&G reported a 2% gain in “organic” sales. Sounds like some new type of beauty product, right?

Nope. It’s a financial term whereby the company “strips out the effects of currency moves, acquisitions and divestments” from its quarterly reports. By implementing this accounting chicanery on shareholders, the company gives the appearance of prosperity when the reality is quite the opposite.

You see, in the real world, a company can’t strip out the effects of a stronger dollar and other activity. Those are real world events, and they affect a company’s bottom line in a tangible way.

But at the end of the day, Wall Street hucksters think it’s easier to turn a blind eye to doctored financials than to announce that Proctor & Gamble’s earnings are now forecast to fall $0.37 per share as a result of currency moves and acquisitions. By the way, the $0.37 decline in earnings is more than triple its previous forecast of $0.11 cents a share. That fact wasn’t even disclosed.

But we know why. Telling the truth about a company’s performance might not make a stock price jump 5% in a day. And that wouldn’t be healthy for the performance bonuses for management or the pump and dump schemes of Wall Street thieves.


Fewer Americans Buying Life Insurance

The number of American households with life insurance is now at its lowest level in more than 50 years. This has put millions of families at significant financial risk should the family’s breadwinner die prematurely.

At present, about 44% of American households have some form of individual life insurance. Another 26% have life insurance through an employer–based plan. That leaves 30% of American households with no form of protection from the calamitous effects of a loss of income.

Even more concerning is knowledge that approximately 11 million American households with children under the age of 18 remain at risk due to the death of a breadwinner. Many of these households are headed by a single parent, which puts an undue strain on the lives of relatives and on the budgets of government welfare programs.

These numbers represent a decline of nearly 39% from 1960 when about 72% of American households owned individual life insurance. The numbers were even higher when adding the number of Americans enrolled in an employer-based plan in the 1960s. Interestingly, this drop in coverage comes at a time when premiums for life insurance have never been lower.

You see, life insurance premiums are based on mortality tables from which insurers calculate the likelihood of premature death. Advances in medicine are responsible for life expectancies in the Unites States reaching 78.8 years in 2015. The longer lifespans means insurers can spread smaller monthly payments over a longer period of time.

Now, despite the trend in lower premiums, life insurers will continue to see falling numbers of policies sold in the United States, which have declined by about 27% – from 40 million policies in 2001 to roughly 27 million policies in 2013. But perhaps more important is something not apparent from those numbers…

You see, in 1960 the average life insurance policy was held for more than a decade before a customer stopped making premium payments. That figure no longer holds true. In 2014, more than 25% of new life insurance policies sold will lapse for non-payment in the first three years after being issued. That figure grows to more than 40% of all life insurance policies after five years.

But this isn’t the only trend working against the sale of life insurance in the United States. Despite several years of moderate improvement in the economy since the height of the financial crisis, the number of workers in the civilian labor force continues to decline.  The number of working Americans is lower now than at any time since 1977 – despite the U.S. population increasing by more than 100 million individuals.

This has resulted in fewer workers earning a paycheck, but something else, too. Growing numbers of family members once on their own are moving back home to live with parents. This is increasing the size of the average American household. It also raises the risk of financial ruin should the primary breadwinner die unexpectedly.

But the problems facing the insurance industry aren’t limited to falling policy counts. Even the 70% of American households that have individual or employer based plans face the consequences of poor decisions.

You see, the main purpose for life insurance is to replace the lost income of a breadwinner. And that means a life insurance policy will need to replace an annual income of about $45,000 per year, according to census data.

But the face amount of life insurance sold in the U.S. has stabilized at roughly $168,000 after rising for nearly two decades. This is an important point.

You see, after paying last expenses and funeral costs, most Americans are left with enough money to replace a breadwinner’s lost income for slightly more than three years. After that, family members will be forced to alter living standards. This often includes the sale of a family home.

It need not be this way. Remember, costs for life insurance have never been lower. It’s possible for a 45-year old male to purchase upwards of $1 million or more of life insurance for less than $50 per month. Of course, the premium will be based on the specific age and health condition of the applicant. But a million dollar policy will easily replace the lost income of a breadwinner.

But the real benefit is that the income is replaced forever – not just three years. And this just might make you a hero to your loved ones.


Of New Year’s Resolutions…

Like many Americans, Federal Reserve Chairwoman, Janet Yellen, made some positive New Year’s resolutions that have recently become known.

Her goal for 2016 is to accomplish the Fed’s goals of 2015, which should have been completed in 2014 because of promises made in 2013 from plans that were made in 2012.

But already her resolutions are in trouble…

According to the Bureau of Labor Statistics, the Fed’s favorite measure of inflation, the core PCE, remains stuck at 1.3% – well below the Fed’s stated goal of 2%. The core PCE, or personal consumption expenditures, measures the average prices of goods and services targeted towards individuals, but excludes food and energy prices.

And this is a problem for the Fed. You see, the Fed has two mandates from Congress.

First, they are to work towards full employment, which translates to a 5% unemployment rate. If you discount the record number of Americans who are not in the labor force, the Fed has achieved one of its primary objectives.

Of course, it’s a Pyrrhic victory. Currently, the labor force participation rate is about equal to the number of working Americans while I was a high school student in the late 1970s. That leaves upwards of about 90 million able bodied Americans out of the labor force.

Please don’t ask me to explain how we can have 90 million Americans NOT in the labor force and yet still have full employment. I don’t understand government math either.

But the second Fed mandate is where Janet Yellen is having trouble…

You see, the Fed signaled last month that it intends to raise the fed funds rate four times this year by as much as 250 basis points. While I don’t expect Yellen to pay too much attention to falling stock prices, she can’t ignore the accumulating evidence for a global slowdown.

There is no way she will be able to stick to her plans for four interest rate hikes. The economy is barely growing now, and any stubborn insistence to maintain the resolution risks tipping the economy into full-blown recession. Using Bayes’ Theorem, the chance for four rate hikes in 2016 are less than 20%.

But there’s another headwind to higher rates…

Should the global slowdown hit the U.S. sooner than expected, Janet Yellen won’t have any ammunition available to avoid recession in the U.S. Lowering rates will have a minimal impact since they’ve been so low for so long.

And any benefits of negative rates will do little to quell recessionary fears while decimating the returns of seniors trying to earn interest on their pensions and other assets.

So that leaves one terrible possibility…

The Fed could potentially accomplish a stealth quantitative easing via a technique called debt monetization. The government could create massive spending programs to stimulate growth and then incur huge deficits to support the spending. The deficits would be financed with government debt printed by the Fed.

This would likely be the beginning of terrible consequences for America if we were to go down than long dark road. In 10 years, the government would have just enough money to pay for two budget items only: interest and entitlements! There would be no money left for defense, infrastructure, or government salaries.

Not exactly a positive outcome…

Until Janet Yellen throws out her New Year’s resolutions, expect 2016 to see a lower stock market, higher Treasuries, and flat precious metals (gold) prices.

At the end of the day, maybe it’s a good thing her resolutions are in trouble. The alternative could be much worse!